Pollution and Waste Management
Air Pollution Improvement Plans
CSC made an air pollution improvement plan by expanding its investment of NT$44.709 billion between 2020 and 2026 to actively improve air quality. In coordination with the “Air Pollution Control Action Plan” promoted by the Executive Yuan, CSC participates in review meetings on air pollution control and improvement of state-owned enterprises conducted by MOEA semi-annually.
| Years of Completion | Improvement Projects | Projected Reduction Results (Unit: tons/year) | |||
|---|---|---|---|---|---|
| NOx | Par | SOx | VOCs | ||
| 2020 | Revamp of the #2 slab reheating furnace for the No.1 Hot Strip Mill | - | 3.6 | 11.5 | - |
| Revamp of the #2 dedusting system for BOF Plant I | 100 | - | - | - | |
| 2021 | Addition of the flue-gas desulfurization equipment to the #1 sinter | 5.3 | 800 | - | - |
| The 1st phase of the enclosed coal storage construction | 14.9 | - | - | - | |
| 2023 | The 2nd phase of the enclosed coal storage construction | 16.7 | - | - | - |
| 2024 | The 1st phase of the coke oven and coke dry quenching construction | 20.5 | - | - | 36.5 |
| 2025 | The 2nd phase of the coke oven and coke dry quenching construction | 20.5 | - | - | 36.5 |
| 2026 | The overhaul of Power Plant I | - | 154.0 | 56.0 | - |
| Total | 177.9 | 957.6 | 67.5 | 73.0 | |
Implementation Results
By taking various air pollution improvement measures, CSC reports air pollution emissions quarterly by using continuous automatic monitoring systems (CEMS) in accordance with the relevant regulations of the Air Pollution Control Act.
| Emissions | 2022 | 2023 | 2024 | EIA Commitment Limits | |
|---|---|---|---|---|---|
| SOx (tons/year) | 4,257 | 4,163 | 4,080 | 34.9 tonnes/day | |
| NOx (tons/year) | 5,603 | 5,209 | 4,982 | 34.6 tonnes/day | |
| Particles (tons/year) | 1,921 | 1,776 | 1,830 | 19.5 tonnes/day | |
| VOCs (tons/year) | 356 | 306 | 264 | - | |
| Dioxin (g-TEQ/year) | 3.50 | 3.11 | 3.15 | - | |
| Ozone Depletion Potential Values(I) | Total (tons, CFC-11 equivalent) |
8.07x10⁻² | 7.03×10⁻² | 5.84×10⁻² | - |
- The refrigerants used by CSC, which are subject to the Montreal Protocol, include R-124 (2-chloro-1,1,1,2-tetrafluoroethane) and R-22 (chlorodifluoromethane). The Ozone Depletion Potential (ODP) has been calculated based on this principle since 2015. The coefficients are referenced from the Annex of the Montreal Protocol
- Figures for SOx, NOx, particles, and VOCs include those from both the head office and flux processing plant.
Environmental Monitoring and Testing
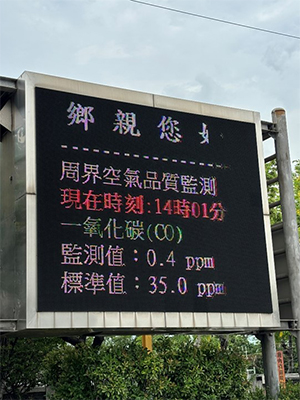
The CSC Environmental Monitoring Center oversees six air quality monitoring stations and has two digital boards that display real-time air quality data for the public. For stationary emission sources, 31 continuous emission monitoring systems (CEMS) serve to monitor traditional pollutants emission intensity and quantity, 30 of which have been connected to KSEPB for government supervision. The current average monthly effective monitoring rate of each instrument can reach 95% and above, which complies with regulatory standards.
If an abnormality is found, please contact CSC by phone (business hours: +886-7-8021111 # 6572; non-business hours or during holidays: +886-7-8021111 #2110.)