Management of the Supply Chains
CSC pledges that the metals used or contained in all products and their packaging do not come from conflict mines in the Democratic Republic of Congo and its surrounding countries as well as any areas controlled by armed forces in these countries. By strengthening the management of the supply chains, the sources of raw materials can be effectively screened and traced. Regarding investment in material sources, any mines with conflict concerns will not be included in the investment assessment. CSC also pays attention to the situations of human rights in the source countries when purchasing equipment and materials and makes possible adjustments accordingly. It also stipulates in the bidding instructions/contract terms that there must be no bribery or infringement, and environmental, safety, and health regulations must also be observed when entering CSC plants.
In accordance with the "Management Regulations on Safety, Hygiene, and Pollution Prevention in Procurement and Contracting Operations," six types of raw materials provided by suppliers were evaluated for indirect identification of environmental aspects in 2025. The results of the evaluation showed that the indirect risk levels of all enterprises were below moderate except for one with a high risk level, which relevant units at CSC would conduct on-site audits and visits jointly to confirm its improvement.

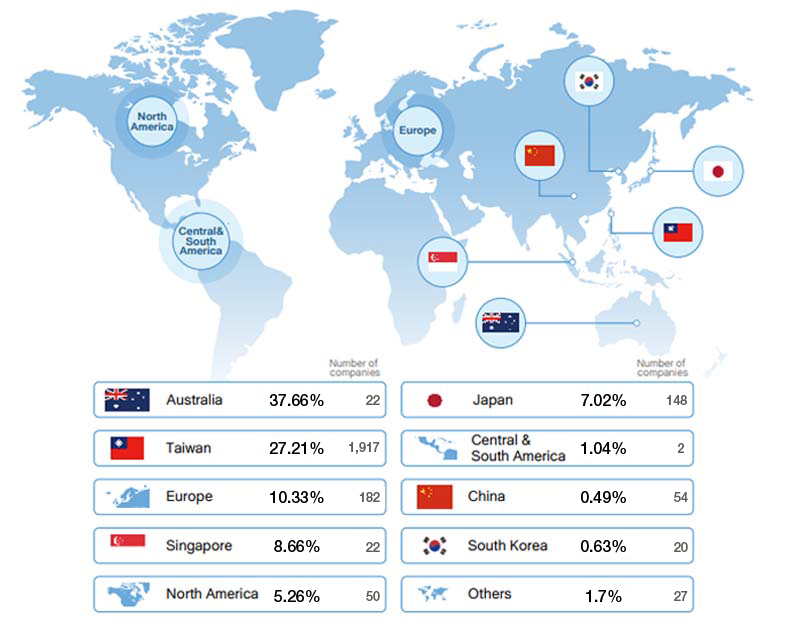
Procurement of Raw Materials and Equipment by Country
| Years | Countries/Regions | Australia | Taiwan | Japan | North America |
Central & South America |
China | Europe | South Korea |
Singapore | Others | Total |
|---|---|---|---|---|---|---|---|---|---|---|---|---|
| 2020 | The numbers of companies | 24 | 1,898 | 162 | 57 | 2 | 85 | 173 | 21 | 23 | 27 | 2,472 |
| Percentages of amounts | 39.6 | 24.2 | 10.9 | 5.0 | 0.2 | 1.9 | 9.8 | 0.7 | 6.3 | 1.4 | 100.0 | |
| 2021 | The numbers of companies | 31 | 1,978 | 171 | 51 | 5 | 82 | 221 | 25 | 37 | 9 | 2,610 |
| Percentages of amounts | 38.89 | 22.63 | 2.59 | 5.68 | 2.02 | 1.82 | 12.94 | 1.03 | 11.40 | 1.00 | 100 | |
| 2022 | The numbers of companies | 27 | 1,905 | 151 | 52 | 3 | 84 | 190 | 25 | 30 | 27 | 2,494 |
| Percentages of amounts | 33.48 | 33.23 | 7.94 | 1.55 | 1.74 | 2.55 | 8.90 | 0.88 | 6.6 | 3.13 | 100 | |
| 2023 | The numbers of companies | 22 | 1,917 | 148 | 50 | 2 | 54 | 182 | 20 | 22 | 27 | 2,444 |
| Percentages of amounts | 37.66 | 27.21 | 7.02 | 5.26 | 1.04 | 0.49 | 10.33 | 0.63 | 8.66 | 1.7 | 100 | |
| 2024 | The numbers of companies | 27 | 1,847 | 127 | 42 | 2 | 79 | 152 | 22 | 22 | 22 | 2,342 |
| Percentages of amounts | 37.49 | 24.79 | 7.92 | 5.54 | 0.87 | 1.37 | 11.94 | 0.78 | 7.91 | 1.39 | 100 | |
| 2025 | The numbers of companies | 20 | 1,708 | 108 | 35 | 4 | 56 | 154 | 22 | 23 | 42 | 2,172 |
| Percentages of amounts | 39.62 | 14.38 | 2.73 | 5.82 | 1.45 | 0.67 | 11.56 | 0.74 | 21.06 | 1.97 | 100 |
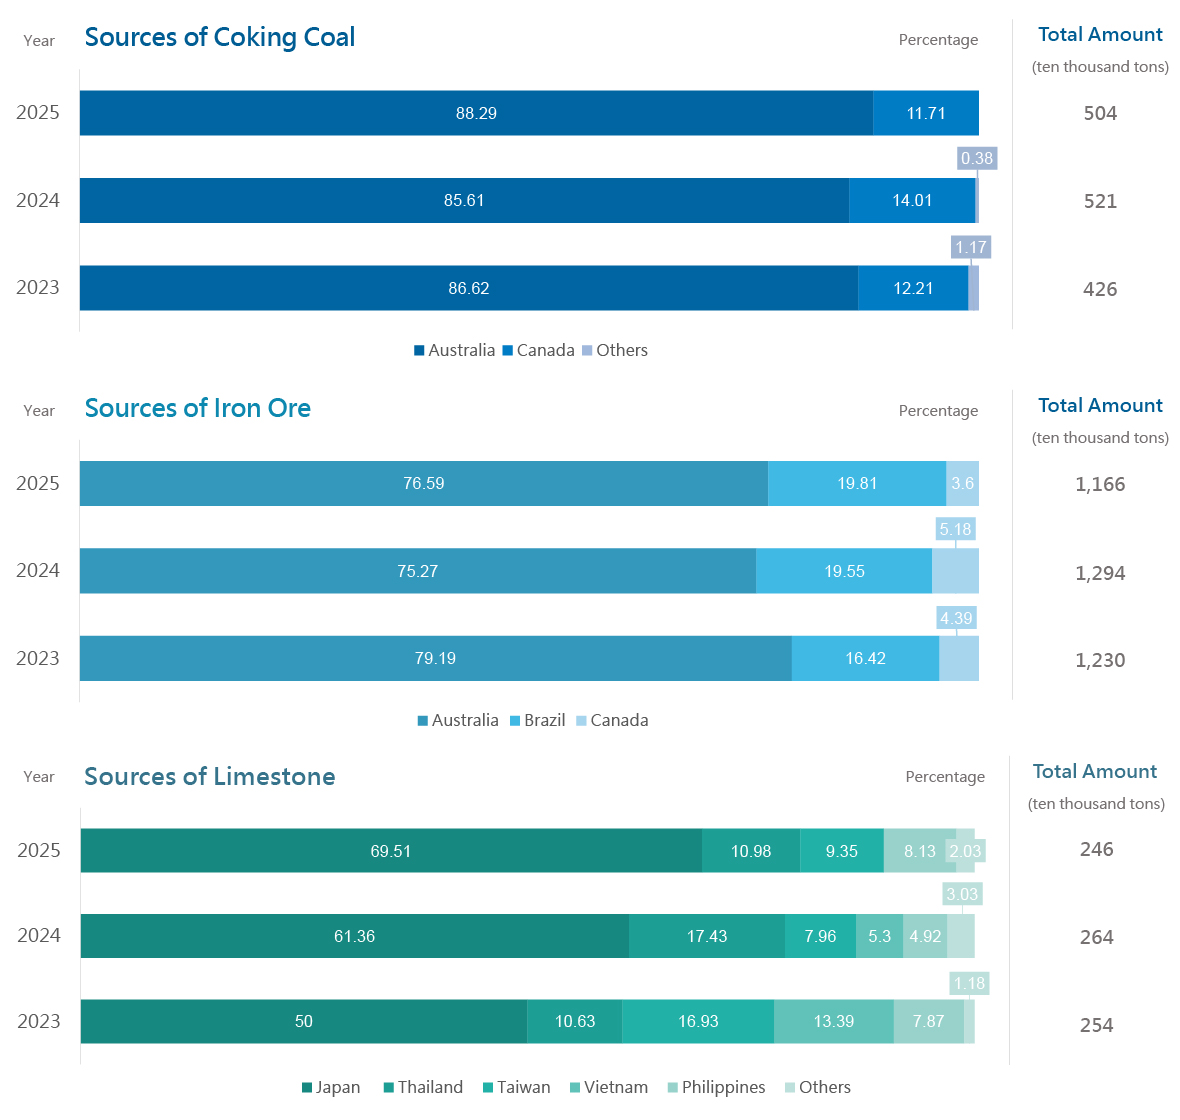
Supply of Major Raw Materials